Monitoring & Analysis + Asset Management
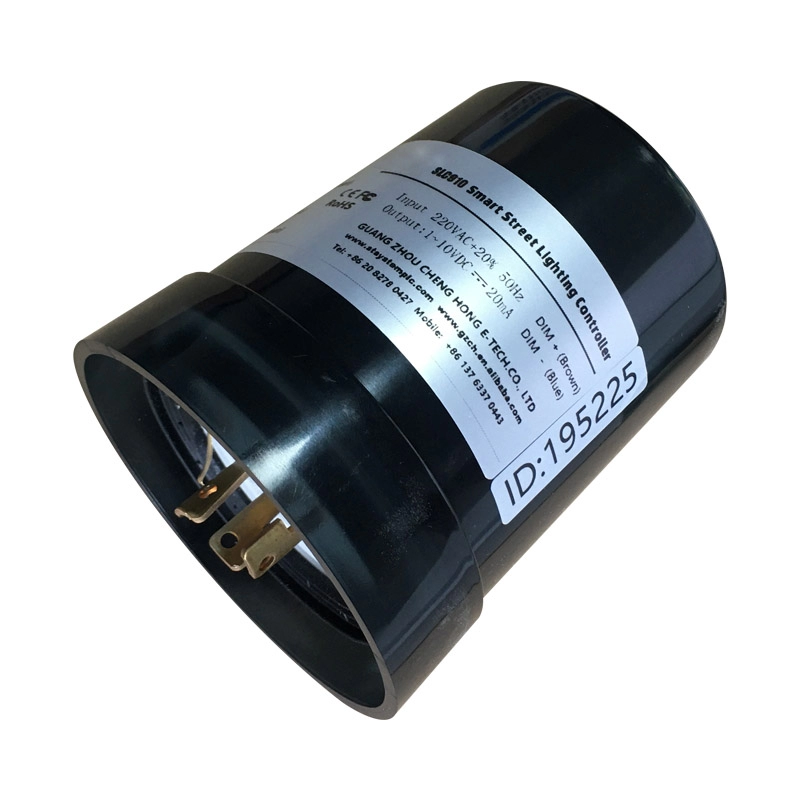
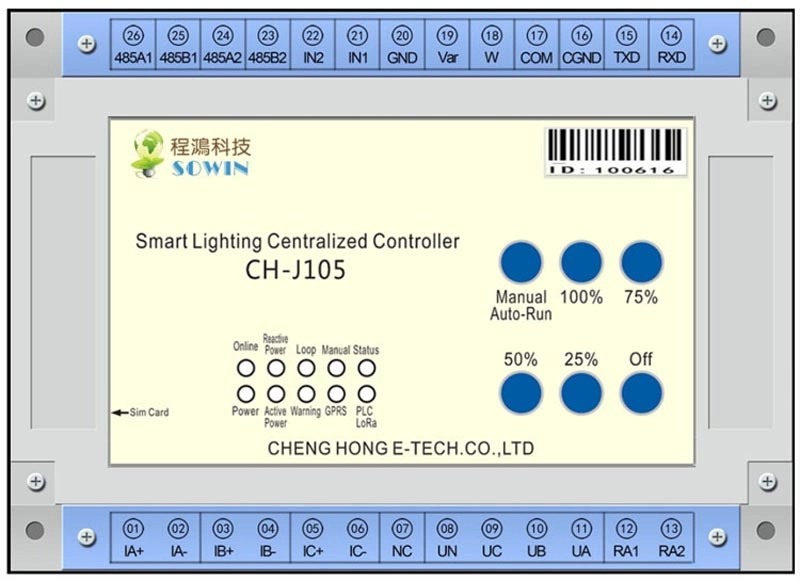
3.1.1 Equipment Monitoring Subsystem
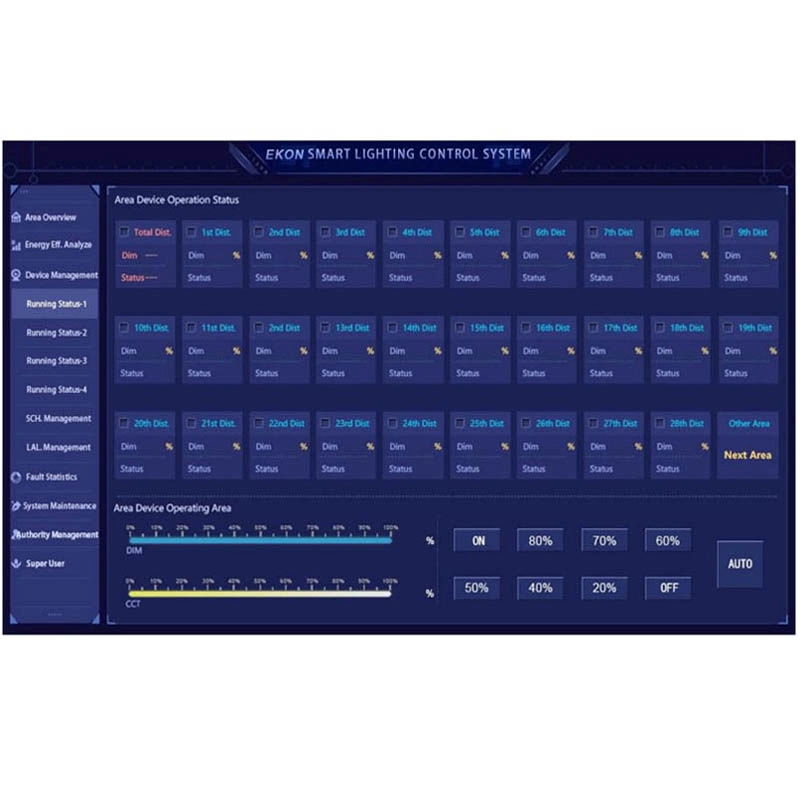
3.1.3.1 System Level Monitoring
The system can count the light rate by region and time. When the light rate is lower than the set threshold, the system automatically alarm.
Area lamps are abnormally turned on or off, the system automatically alarm.
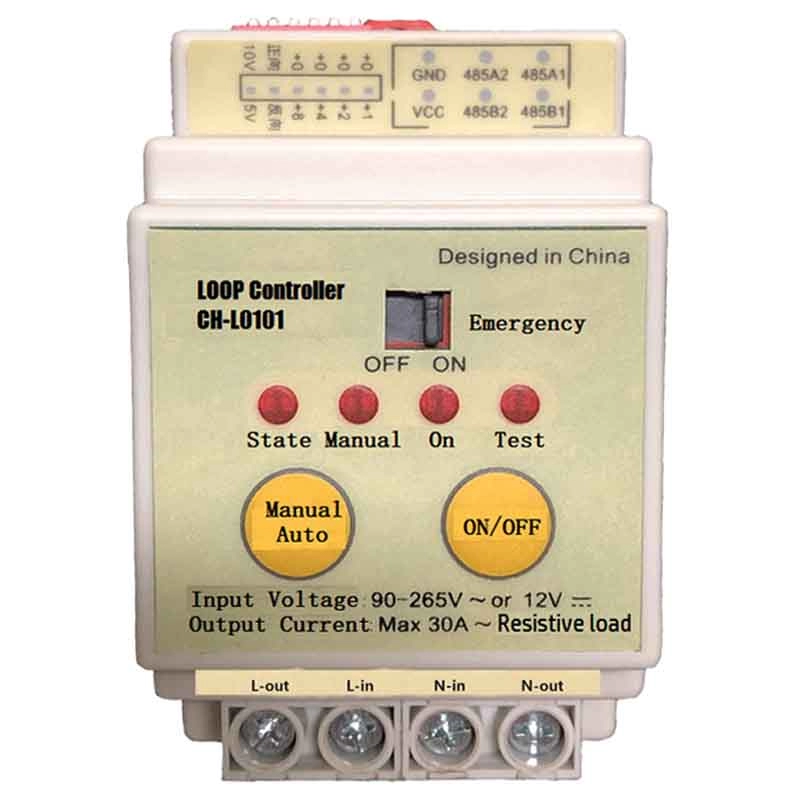
3.1.3.2 Loop-Level Monitoring
Monitor the power supply loop to realize grid health analysis and power grid quality analysis.
Monitor loop control equipment to realize loop state monitoring.
The electrical parameters of the communication bus of the loop are monitored to realize the health analysis of the communication bus.
3.1.3.3 Single Lamp-Level Monitoring
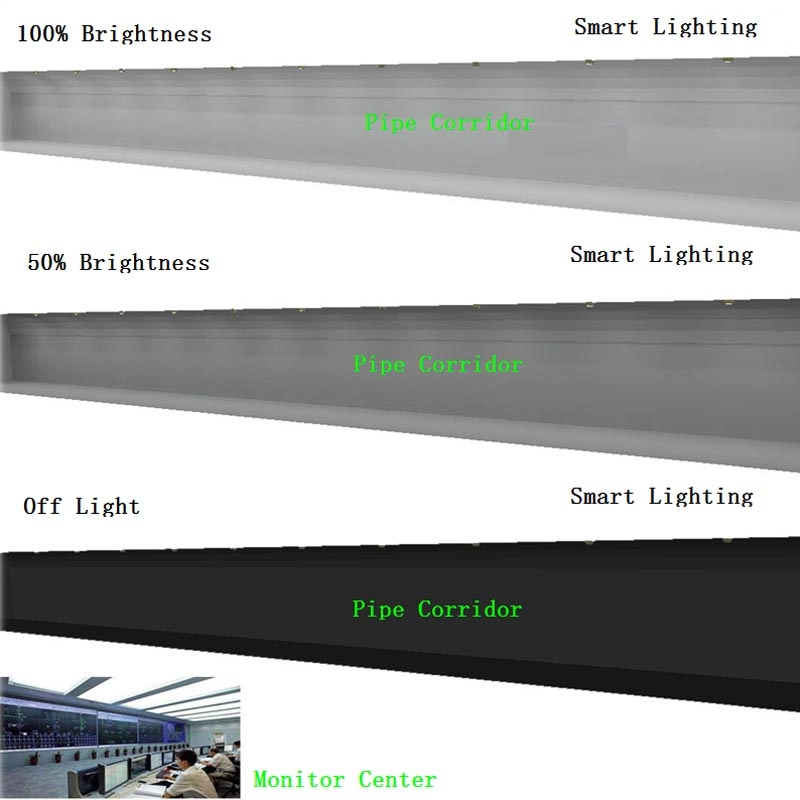
Monitor the lamps, realize the monitoring of lamp On/Off, Dimming status, to realization of the multiple faults, electrical parameters and electricity consumption collections.
3.1.4 Energy Consumption Analysis Subsystem
3.1.4.1 Power Acquisition Module.
The total power consumption of lighting fixtures can be collected and statistically analyzed, and the power consumption of the power supply circuit can be collected and statistically analyzed. It can be inquired by day, month, and year.
3.1.4.2 Power Saving Rate Statistics Module
Comparing the energy consumption of lighting fixtures with the actual electricity consumption, by calculating the daily, monthly, and annual electricity saving rate, the managers can understand the current and historical lighting energy consumption at a glance, and provide management basis for managers.
3.1.4.3 Fault Alarm Module
When the power-saving rate of a circuit is higher than the set power-saving rate, abnormal operation of the lighting device, lamp failure, abnormal power supply line or wrong lighting scheme will occur. At this time, the system will automatically generate alarm events to remind managers of risks; At the same time, based on the collected information of the system, problem points and causes can be located, providing managers with a basis for formulating solutions.
3.1.4.4 Line Loss Analysis Module
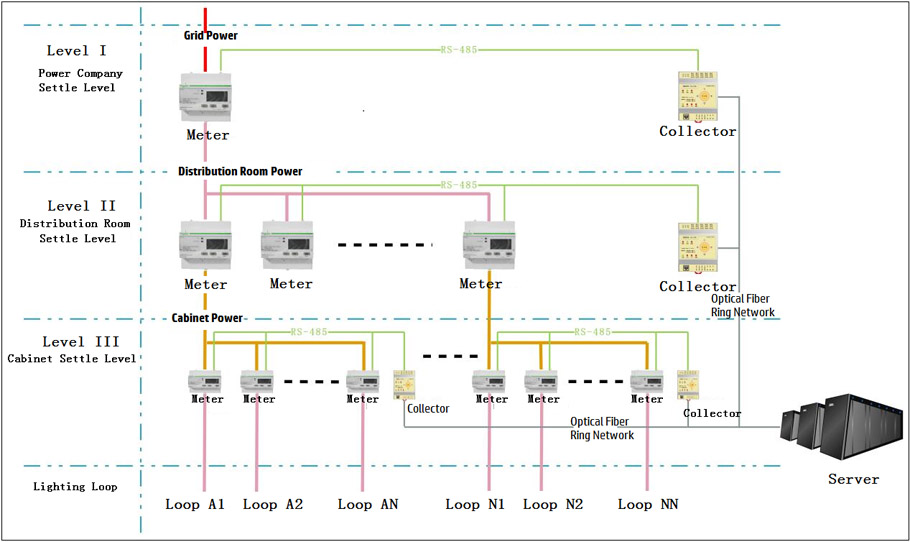
Collect all levels of electrical energy, calculate the line loss of each level, and find abnormalities in the Grid.
3.1.5 Expert Analysis Subsystem
3.1.5.1 Lamp Life time Warning
When the lifetime of the lamp is expired or is close to expire, the system automatically generates the warning message, and the maintenance personnel can centrally arrange the replacement according to the information to avoid abnormal accidents.
3.1.5.2 Light Attenuation Compensation Management
Through long-term sampling data, analyze the light attenuation of lamp fixtures, The system automatically compensates for light attenuation
3.1.5.3 Recommendations for the best Smart Solution.
Through the long-term sampling data, the optimization scheme of the original control scheme in some areas is analyzed to realize more optimized energy saving, such as reducing the frequency of people's passage and increasing the equipment to block the light, etc.
3.1.5.4 Equipment Abnormality Assessment
Through statistical analysis, the system can calculate the failure rate of a single device in the same time period. When the failure rate exceeds the set value, the system will warn through the man-machine interface.
3.1.5.5 Staff Performance Evaluation
Through statistical analysis, the system collects statistics on the troubleshooting efficiency and removal rate, and collects statistics on the number of inspections and switch usage, so as to quantify the performance of the staff.
3.1.5.6 Grid Quality Analysis & Warning
Collect and analyze the Grid, through the statistical analysis of data such as harmonics, reactive components, voltage, current, etc., when the data is abnormal, the system will warn through the man-machine interface.
3.1.5.7 Realization of Lamp Life Extension
Through real-time monitoring of the lamp temperature, the power will be automatically adjusted to prevent it from operating in an environment exceeding the design standard, so as to extend the lamp lifetime.

Subscribe to our weekly newsletter and receive exclusive offers on products you love!
 X
X


 Gold Supplier